> ## Documentation Index
> Fetch the complete documentation index at: https://docs.quantumvoid.org/llms.txt
> Use this file to discover all available pages before exploring further.
# Portfolio
> Track your account equity over time, see per-exchange allocation, bot performance, and open positions
# Portfolio
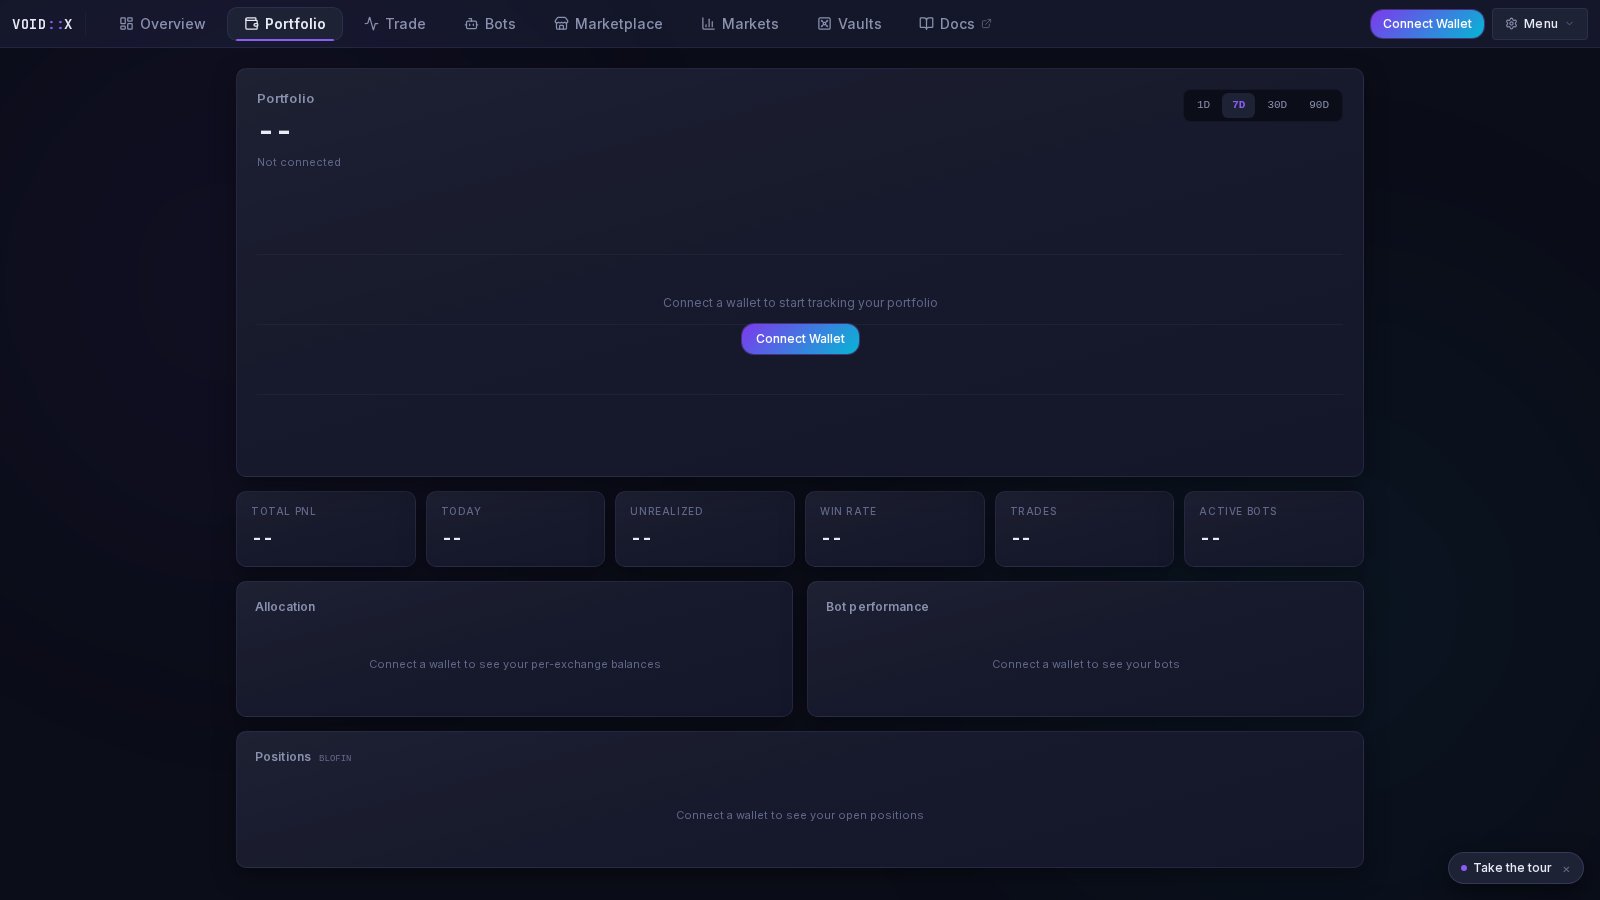
The **Portfolio** tab is your account's scoreboard: an equity chart showing how your balance has evolved, headline performance stats, a per-exchange allocation breakdown, a ranked list of your bots, and your open positions — all on one page.
You can reach it from the nav bar, or by **clicking the equity sparkline** in the Overview tab's equity strip.
 ***
## Equity Chart
The hero of the page: your **total equity** as a large headline, with an area chart of equity history below it.
* **Timeframes** — 1D, 7D, 30D, 90D tabs
* **Period change** — the gain/loss for the selected window (in dollars and percent), computed strictly from the first and last points of the recorded series
* **Hover tooltip** — exact equity and timestamp at any point on the curve
### How Equity History Works
Equity snapshots are recorded **server-side every 5 minutes** once you have exchange API keys saved — the terminal does not need to be open for recording to continue.
History starts when recording starts. There is **no backfill** — the chart cannot show equity from before your keys were added. Right after setup you will see "Collecting equity snapshots — first curve appears within minutes," and the longer timeframes fill in as days pass.
***
## Stat Tiles
A row of tiles under the chart summarizes performance:
* **Total PnL** — cumulative profit and loss
* **Today** — last 24-hour performance
* **Unrealized** — open position profit and loss
* **Win Rate** — percentage of profitable trades
* **Trades** — total trade count
* **Active Bots** — running vs. total (e.g. `3 / 5`)
***
## Allocation
The Allocation card breaks your equity down **per exchange**:
* Each connected exchange shows its equity in dollars and as a **percentage share of your total**, with a colored share bar (BloFin blue, Bybit gold, and so on)
* Exchanges are sorted largest first
* A **Total** row sums everything at the bottom
* If an exchange's balance fetch fails, the row flags the error instead of silently showing zero
Allocation reads live balances from each exchange every 30 seconds — it is the quickest way to sanity-check that your capital is split the way you intend across venues.
***
## Bot Performance
A ranked list of all your bots:
* **Status dot** — green running, red error, grey stopped
* **Bot name** and **strategy** label
* **PnL** — signed, color-coded
Running bots sort to the top, then by PnL magnitude. Click any row (or **View all**) to jump to the [Bots](/features/bot-management) tab for full controls.
***
## Positions
An open-positions table for the currently selected exchange:
| Column | Meaning |
| ------ | ------------------------------------- |
| Symbol | Trading pair, with token logo |
| Side | LONG / SHORT badge |
| Size | Position size |
| Entry | Average entry price |
| Mark | Current mark price |
| uPnL | Unrealized PnL in dollars and percent |
Positions are sorted by PnL magnitude so your biggest winners and losers surface first.
***
## Guests and Fresh Accounts
* **Not connected?** The page renders with placeholder dashes and a **Connect Wallet** button inside the chart frame — connect to start tracking.
* **Connected, no exchange keys?** Add keys via the Add Exchange flow; snapshot recording begins automatically once they are saved.
* **Just added keys?** The chart shows the collecting state until at least two snapshots exist, then the curve appears.
***
## Related Documentation
* **[Terminal Overview](/features/dashboard-overview)** — the equity strip and sparkline that link here
* **[Bot Management](/features/bot-management)** — act on what the Bot performance list shows you
* **[Trading Console](/features/trading-console)** — manage the positions listed here
***
## Equity Chart
The hero of the page: your **total equity** as a large headline, with an area chart of equity history below it.
* **Timeframes** — 1D, 7D, 30D, 90D tabs
* **Period change** — the gain/loss for the selected window (in dollars and percent), computed strictly from the first and last points of the recorded series
* **Hover tooltip** — exact equity and timestamp at any point on the curve
### How Equity History Works
Equity snapshots are recorded **server-side every 5 minutes** once you have exchange API keys saved — the terminal does not need to be open for recording to continue.
History starts when recording starts. There is **no backfill** — the chart cannot show equity from before your keys were added. Right after setup you will see "Collecting equity snapshots — first curve appears within minutes," and the longer timeframes fill in as days pass.
***
## Stat Tiles
A row of tiles under the chart summarizes performance:
* **Total PnL** — cumulative profit and loss
* **Today** — last 24-hour performance
* **Unrealized** — open position profit and loss
* **Win Rate** — percentage of profitable trades
* **Trades** — total trade count
* **Active Bots** — running vs. total (e.g. `3 / 5`)
***
## Allocation
The Allocation card breaks your equity down **per exchange**:
* Each connected exchange shows its equity in dollars and as a **percentage share of your total**, with a colored share bar (BloFin blue, Bybit gold, and so on)
* Exchanges are sorted largest first
* A **Total** row sums everything at the bottom
* If an exchange's balance fetch fails, the row flags the error instead of silently showing zero
Allocation reads live balances from each exchange every 30 seconds — it is the quickest way to sanity-check that your capital is split the way you intend across venues.
***
## Bot Performance
A ranked list of all your bots:
* **Status dot** — green running, red error, grey stopped
* **Bot name** and **strategy** label
* **PnL** — signed, color-coded
Running bots sort to the top, then by PnL magnitude. Click any row (or **View all**) to jump to the [Bots](/features/bot-management) tab for full controls.
***
## Positions
An open-positions table for the currently selected exchange:
| Column | Meaning |
| ------ | ------------------------------------- |
| Symbol | Trading pair, with token logo |
| Side | LONG / SHORT badge |
| Size | Position size |
| Entry | Average entry price |
| Mark | Current mark price |
| uPnL | Unrealized PnL in dollars and percent |
Positions are sorted by PnL magnitude so your biggest winners and losers surface first.
***
## Guests and Fresh Accounts
* **Not connected?** The page renders with placeholder dashes and a **Connect Wallet** button inside the chart frame — connect to start tracking.
* **Connected, no exchange keys?** Add keys via the Add Exchange flow; snapshot recording begins automatically once they are saved.
* **Just added keys?** The chart shows the collecting state until at least two snapshots exist, then the curve appears.
***
## Related Documentation
* **[Terminal Overview](/features/dashboard-overview)** — the equity strip and sparkline that link here
* **[Bot Management](/features/bot-management)** — act on what the Bot performance list shows you
* **[Trading Console](/features/trading-console)** — manage the positions listed here