Portfolio
The Portfolio tab is your account’s scoreboard: an equity chart showing how your balance has evolved, headline performance stats, a per-exchange allocation breakdown, a ranked list of your bots, and your open positions — all on one page. You can reach it from the nav bar, or by clicking the equity sparkline in the Overview tab’s equity strip.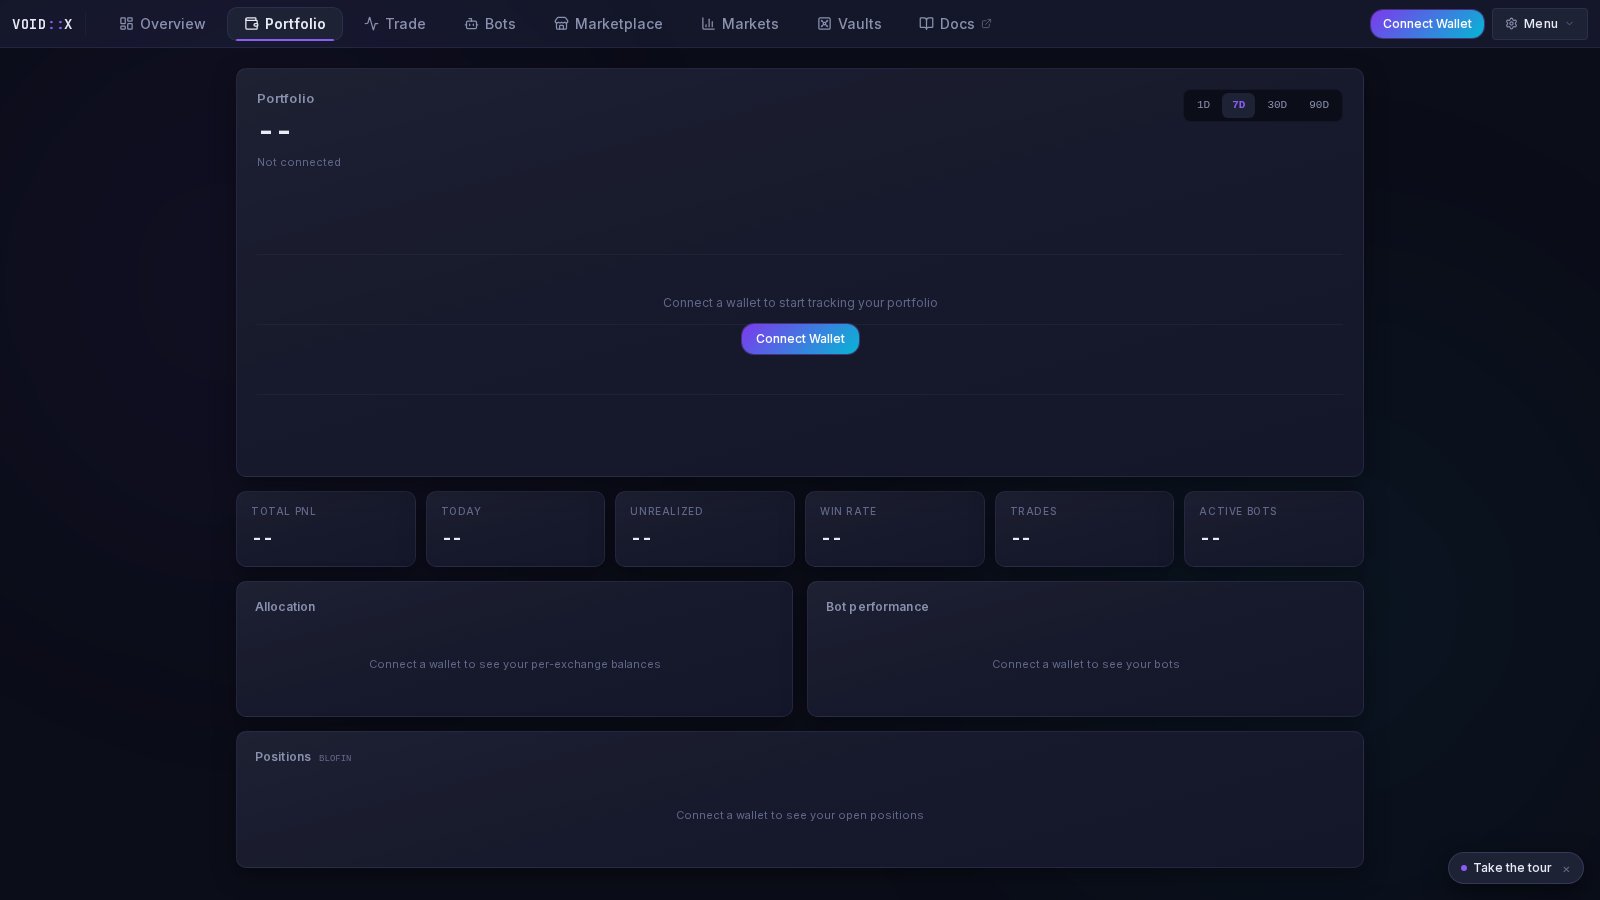
Equity Chart
The hero of the page: your total equity as a large headline, with an area chart of equity history below it.- Timeframes — 1D, 7D, 30D, 90D tabs
- Period change — the gain/loss for the selected window (in dollars and percent), computed strictly from the first and last points of the recorded series
- Hover tooltip — exact equity and timestamp at any point on the curve
How Equity History Works
Equity snapshots are recorded server-side every 5 minutes once you have exchange API keys saved — the terminal does not need to be open for recording to continue.History starts when recording starts. There is no backfill — the chart cannot show equity from before your keys were added. Right after setup you will see “Collecting equity snapshots — first curve appears within minutes,” and the longer timeframes fill in as days pass.
Stat Tiles
A row of tiles under the chart summarizes performance:- Total PnL — cumulative profit and loss
- Today — last 24-hour performance
- Unrealized — open position profit and loss
- Win Rate — percentage of profitable trades
- Trades — total trade count
- Active Bots — running vs. total (e.g.
3 / 5)
Allocation
The Allocation card breaks your equity down per exchange:- Each connected exchange shows its equity in dollars and as a percentage share of your total, with a colored share bar (BloFin blue, Bybit gold, and so on)
- Exchanges are sorted largest first
- A Total row sums everything at the bottom
- If an exchange’s balance fetch fails, the row flags the error instead of silently showing zero
Bot Performance
A ranked list of all your bots:- Status dot — green running, red error, grey stopped
- Bot name and strategy label
- PnL — signed, color-coded
Positions
An open-positions table for the currently selected exchange:
Positions are sorted by PnL magnitude so your biggest winners and losers surface first.
Guests and Fresh Accounts
- Not connected? The page renders with placeholder dashes and a Connect Wallet button inside the chart frame — connect to start tracking.
- Connected, no exchange keys? Add keys via the Add Exchange flow; snapshot recording begins automatically once they are saved.
- Just added keys? The chart shows the collecting state until at least two snapshots exist, then the curve appears.
Related Documentation
- Terminal Overview — the equity strip and sparkline that link here
- Bot Management — act on what the Bot performance list shows you
- Trading Console — manage the positions listed here